10. Optimization Method Comparison and Final Device
이 페이지에서 확인할 내용
| Item | Description |
|---|---|
| Method 1 | 각 metric과 변화율을 직접 비교 |
| Method 2 | Ion/Ioff와 SS를 한 평면에서 비교 |
| Decision rule | 목표 Ion을 유지하면서 leakage와 SS가 더 낮은 조건 선택 |
| Final result | Method 2 candidate |
Final Candidate Comparison
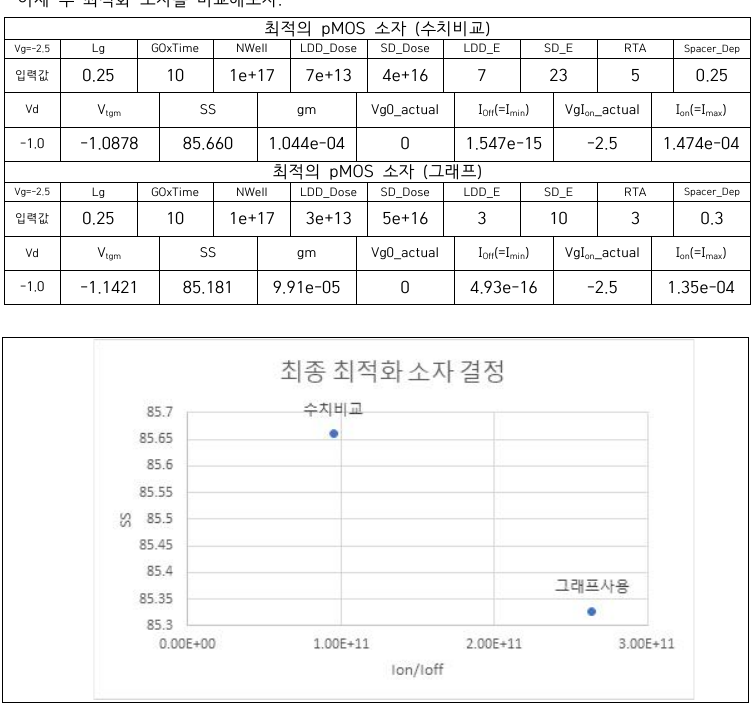
Figure. Method 1과 Method 2 최종 후보의 공정 조건과 전기적 성능 비교.
| Metric | Numerical Method | Plot-Based Method | Difference |
|---|---|---|---|
| Ion | 1.474e-04 |
1.35e-04 |
plot method 약 9.2% 낮음 |
| Ioff | 1.547e-15 |
4.93e-16 |
plot method 약 68.1% 낮음 |
| SS | 85.660 | 85.181 | plot method 약 0.56% 낮음 |
| gm | 1.044e-04 |
9.91e-05 |
plot method 약 5.3% 낮음 |
Interpretation
Numerical Method
- 특정 metric의 변화량과 공정 trend를 확인하기 쉬움
- 높은 Ion 조건을 찾는 데 유리
- Ion, Ioff, SS가 서로 다른 방향으로 움직일 때 최종 판단이 복잡함
- 초기 단계에서 제외한 후보가 후속 parameter와 결합했을 때 좋아질 가능성을 놓칠 수 있음
Plot-Based Method
- on/off ratio와 SS trade-off를 한눈에 확인
- 낮은 leakage를 전류비에 반영해 후보 선택 가능
- 수치 비교에서 제외했던 낮은 LDD 후보를 다시 평가
- axis range, point overlap, candidate threshold에 따라 시각적 판단이 달라질 수 있음
Final Process Condition
| Parameter | Final Value |
|---|---|
| Lg | 0.25 |
| GOxTime | 10 |
| NWell | 1e17 cm^-3 |
| LDD_Dose | 3e13 cm^-2 |
| LDD_E | 3 keV |
| SD_Dose | 5e16 cm^-2 |
| SD_E | 10 keV |
| RTA | 3 s |
| Spacer_Dep | 0.30 |
| Vg | -2.5 V |
| Vd | -1.0 V |
Electrical Results
| Metric | Result | Target | Check |
|---|---|---|---|
| Vtgm | -1.1421 V | pMOS negative threshold | Pass |
| Ion | 1.35e-04 A/µm |
> 1e-5 |
Pass |
| Ioff | 4.93e-16 A/µm |
< 1e-14 |
Pass |
| SS | 85.181 mV/dec | < 100 |
Pass |
| gm | 9.91e-05 |
reference | - |
| Vg0_actual | 0 V | 0 V | Verified |
| VgIon_actual | -2.5 V | -2.5 V | Verified |
Final Decision
두 조건 모두 target을 만족했습니다. 그래프 기반 조건은 Ion과 gm이 조금 낮았지만 목표를 충분히 초과했고, Ioff 감소 폭이 훨씬 컸으며 SS도 개선되었습니다.
따라서 전체적인 switching/leakage 균형을 기준으로 그래프 기반 조건을 최종 소자로 선정했습니다. 이 결과는 모든 가능한 공정 조합의 global optimum이 아니라 평가한 split 범위에서 선택한 balanced optimum으로 해석합니다.
Data and Report
Next: Limitations and Next Steps
Summary:
The plot-based candidate was selected because its substantial leakage reduction outweighed the moderate reduction in drive current.